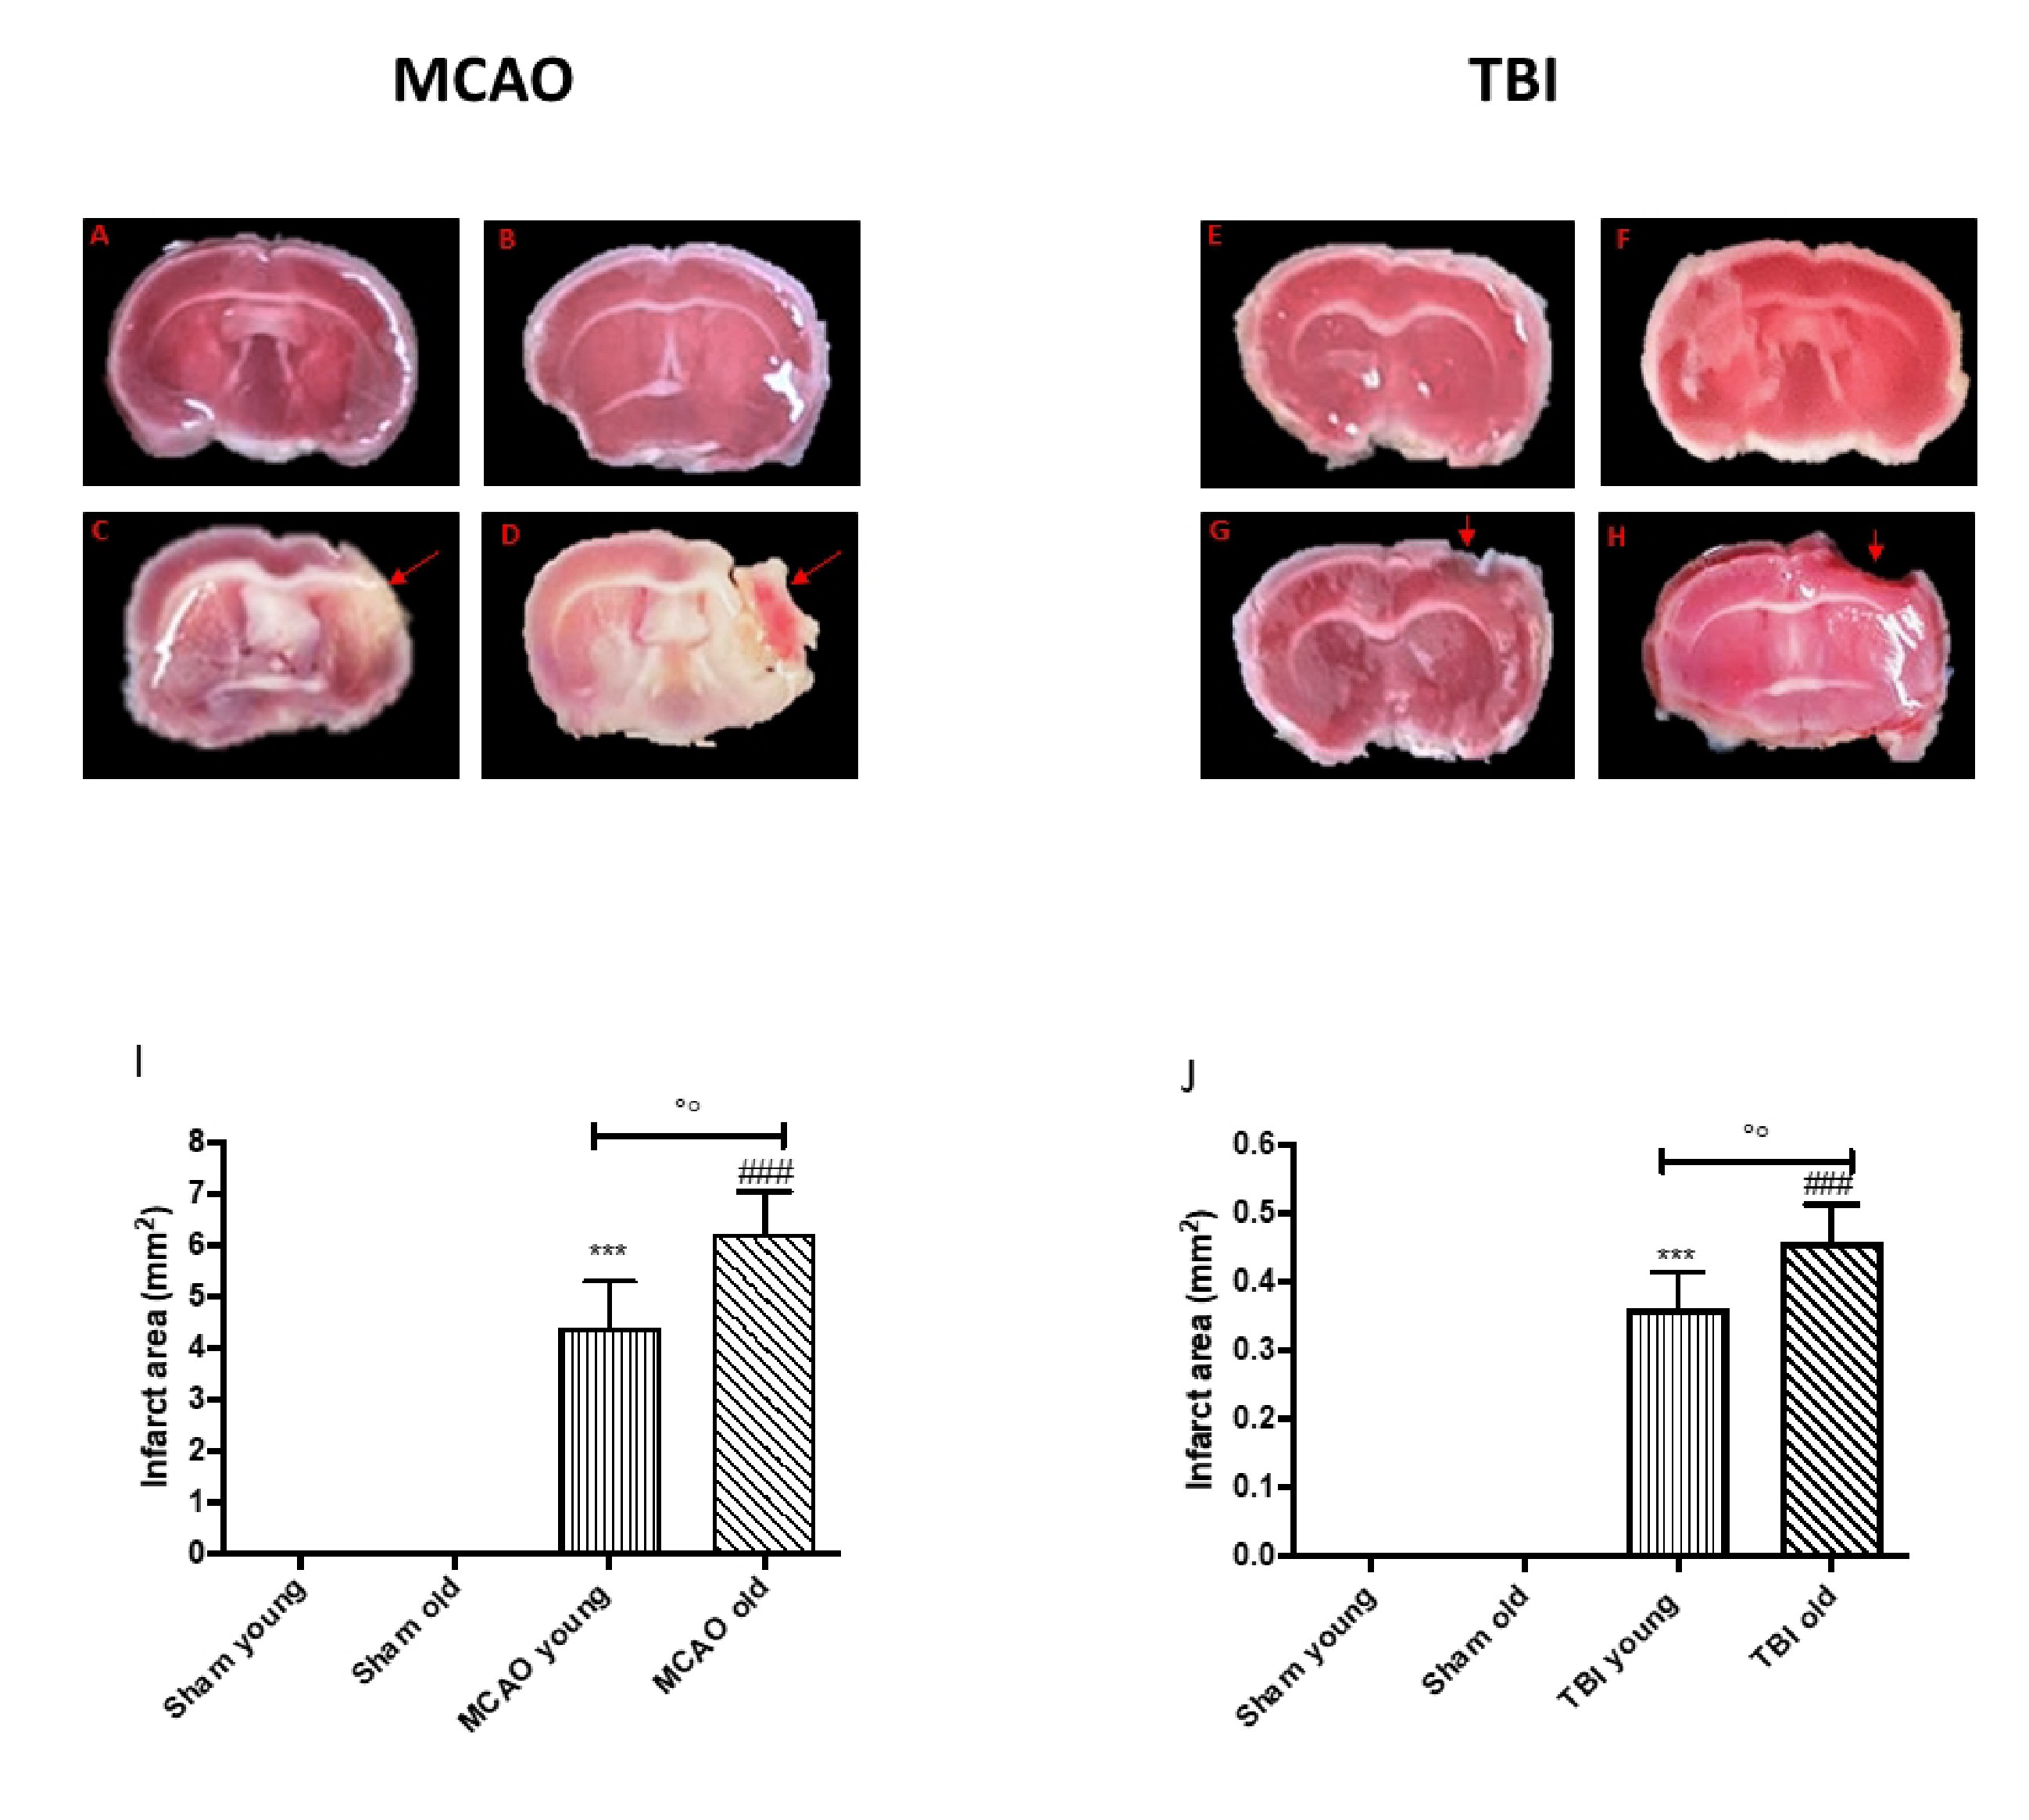
Fig. 3. Difference between young and old mice on injury volume. TTC staining of brain section after MCAo: sham young (A), sham old (B), MCAo young (C) and MCAo old (D), quantification of infarct area (I). TTC staining of brain section after TBI: sham young (E), sham old (F), TBI young (G) and TBI old (H), quantification of infarct area (J). The red arrows indicated infarct area. ***p <0.001 vs sham young; ###p <0.001 vs sham old; °° p <0.01 vs TBI young.